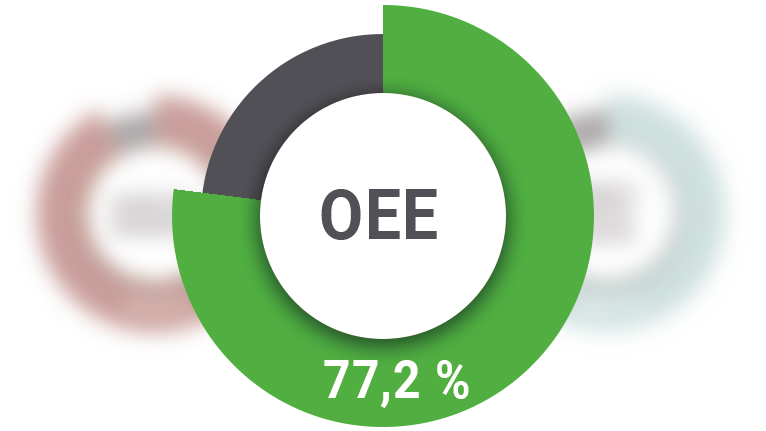
OEE dashboards - what can they provide for your company?

Increasing efficiency and reducing costs are undoubtedly the primary goals of every company. The most important prerequisite for achieving these goals is transparency about the processes. How busy are your machines? Do the planned downtimes and setup times match? Is production running without errors? The Overall Equipment Effectiveness (OEE) gives you an answer to these questions.

Based on comprehensive production data and machine data acquisition, OEE dashboards provide you with detailed insights into the status of your production. You can see the ACTUAL status of your machines and systems and derive optimization measures. This results in significant added value:

  • optimization of existing plants instead of installing new machines
  • data-based process understanding to minimize errors
  • insight into reasons for losses (overproduction, waiting times, rejects, ...)

Monitor and optimize production with OEE


Overall equipment effectiveness for the machine • the line • the shopfloor

When looking at OEE figures, it is worth taking a look at the different levels of your production. The smallest unit is the respective machine; its downtimes are the most granular starting point for optimization. Looking at entire lines reveals quality factors, while OEE figures for the shopfloor reflect the overall picture of your production. The levels at which you interpret and analyze values depend on your conditions and objectives.

OEE data acquisition at machine level

At machine level

Capture Overall Equipment Efficiency directly at the machine to gain insight into how busy each machine is and how efficiently it is operating. At this level of data collection, you can directly identify potential weaknesses and productivity losses and derive action requirements.

OEE data acquisition based on the production line

At line level

A close look at your production lines is essential to assess the quality of production. Here you make the interaction of the individual machines measurable and create transparency in your production process. This enables you to identify sources of error and tap further optimization potential.

OEE for the whole shopfloor

At the shopfloor level

It is particularly important to also record OEE key figures for the shopfloor as a whole. According to your machines and lines as well as their individual key figures, this gives you an overall picture of your production. On the basis of a store floor value, you can clearly see how efficiently you are producing and how successful your optimizations are.
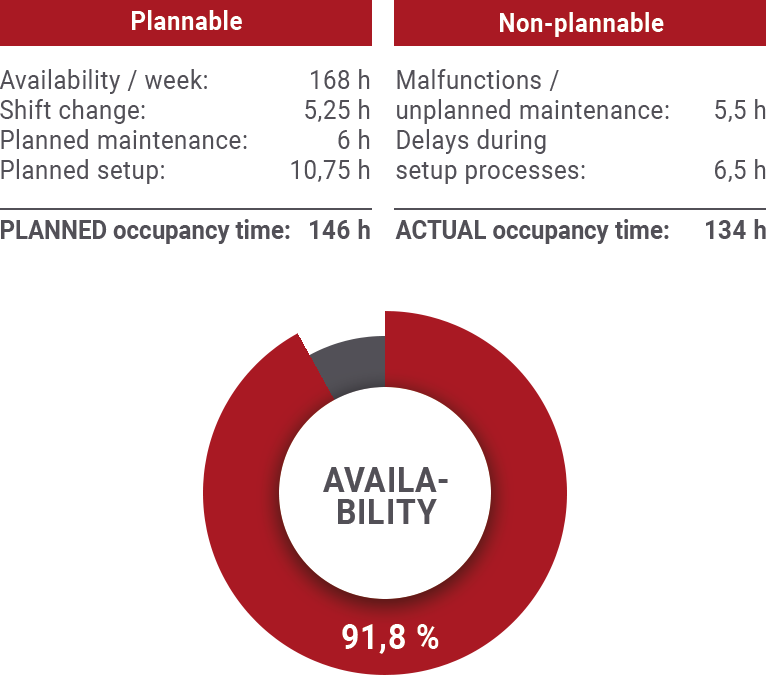


Do you know what your production efficiency is? An OEE example

Very few machines run uninterrupted 24 hours a day, 7 days a week. Neither can you plan all downtimes, output losses or performance losses in advance. That's why monitoring machine and operational data is all the more important, because even small inconsistencies can have a big impact on overall plant effectiveness. The following OEE example is intended to illustrate this.

Plant availability

In perfect production, the machine runs 24/7. If it weren't for shift changes, setup processes and maintenance work. All this can be planned and assigned specific time values. This gives you a realistic planned machine utilization time. In relation to this value, you have to record the actual plant availability. This quickly shows that machines are idle for much longer than planned.
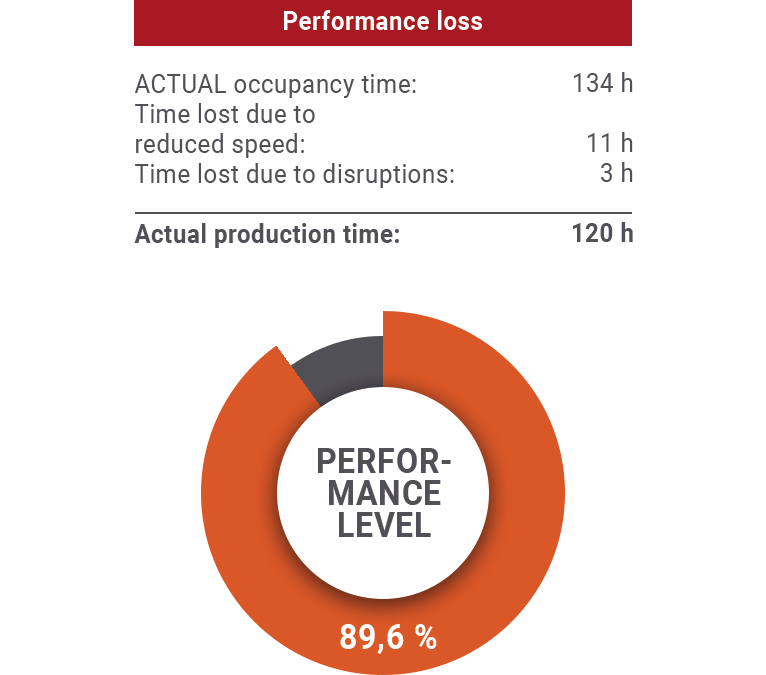
 

OEE value plant availability

Performance level

You know the occupancy times of your machines and systems. But what about the performance level? In fact, a machine does not always run at top speed, or short-term malfunctions slow down production. Only when you collect OEE data can your machine provide information on the real power lost, which in turn gives you a more accurate view of the effectiveness of your plant.
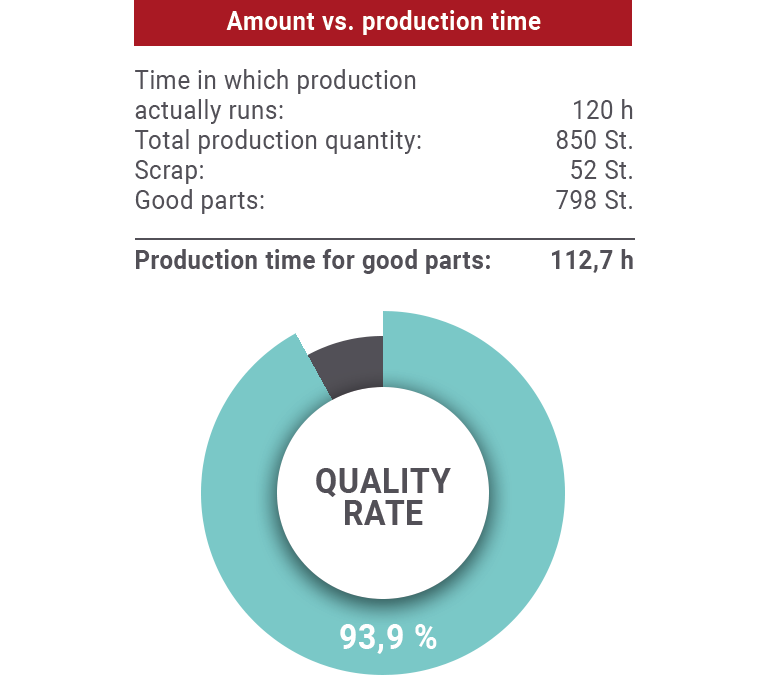
 

OEE value performance level

Quality rate

To gain insight into the quality of your production, you also need to record how much scrap the machines produce. This key figure is also essential for Overall Equipment Effectiveness: for every scrap part, your machine has ultimately worked for nothing and lost valuable time. You can see potential for optimization if you put good parts and rejects in relation to production time.


OEE value quality rate

OEE (Overall equipment effectiveness)

Availability times performance times quality, that's the total equipment effectiveness of your machine or system. If the result is 100 percent, production is running perfectly in the respective period under consideration. If it is above 100 percent, the machine or line is exceeding your plan.

If it is below 100 percent, the data will provide you with insights into optimization potential. However, it is always a prerequisite that you continuously record this data and monitor the OEE value. You should also clearly define what your target OEE value is. Make your machines talk and leverage productivity potential.

OEE dashboards for data acquisistion


Our services around the implementation of OEE dashboards

Gain data by machine connection

Connecting machines and creating prerequisites

Before you can evaluate the data from your machines and make it available for OEE analyses, you first have to make sure that your machines also provide the desired data. This is where we come in:

  • we make existing machines talk by means of suitable sensor technology
  • we develop interfaces with a high degree of standardization for your shopfloor
  • and establish end-to-end connectivity to your IT/OT systems.

Learn more  


OEE dashboards for data acquisition

Dashboards for OEE and other KPIs

As soon as your machines deliver data and this data can be put into a standardized format, it gives you insight into your Overall Equipment Effectiveness or other KPIs that are important for your production. Using a dashboard tailored precisely to your needs, we visualize the processes on your shopfloor for you. In this way, we provide you with an insight into the condition of your machines, from which you can derive optimization measures. With OEE dashboards you:

  • combine operating data and machine data for more transparency
  • record downtimes and use the data for precise planning
  • make reasons for losses visible and improve production processes
  • analyze data and key figures for optimized production and maintenance planning.


Our references related to dashboards (selection)

Logo Evonik


KPI dashboards to improve production processes

Learn more

Logo Profiroll


Intelligent worker guidance with individual dashboards

Learn more

Logo Schlötter


OEE key figure calculation for condition monitoring of plants

Learn more


Frequently asked questions about OEE

What is OEE?

OEE stands for "Overall Equipment Effectiveness" and is the key figure for the efficiency of production plants. OEE is calculated from the three factors availability, performance and quality. The aim of OEE is to increase the efficiency of production plants by identifying bottlenecks, downtimes and quality problems. By correcting the identified problems, a higher overall plant efficiency can be achieved.

Why is OEE important?

OEE is important because it gives a comprehensive overview of the effectiveness of production. It helps to identify and eliminate bottlenecks and waste. By improving OEE, companies can increase productivity, reduce costs and shorten delivery times. OEE enables better planning and control of production and creates a foundation for understanding across departments.

What makes a good dashboard?

A good dashboard should be clearly laid out, user-friendly, and display all important information at a glance. A good dashboard also comes up with a clear visual presentation of the data and makes it possible to quickly identify trends and correlations. Filters, search functions and alerts are also relevant features.

What does OEE consist of?

OEE is made up of three factors: Availability, Performance and Quality. Availability measures how long the production plant is available. Performance measures how effectively the plant operates, while quality measures the number of defective products. OEE is calculated by multiplying these factors: OEE = Availability x Performance x Quality.

We answer your questions about OEE and dashboards

Regardless of whether your machines already provide data that you can use for OEE analyses or whether you first want to lay the foundations for end-to-end data collection: We support you on your way to optimal transparency in your production processes. Contact us and we will be happy to discuss concrete scenarios and to-dos with you.